To what degree can the problems the UK is experiencing with blocked drains and sewers and plastic pollution be chalked up to bad habits and a simple lack of understanding among the general public?
That’s a question Lanes for Drains has been trying to answer for some time, which is why we’ve been conducting a regular series of surveys to shed light on awareness levels among Britons of how their household habits affect the health of the national drainage network and wider environment. Having previously carried out similar polls in 2017 and 2018, we turned to the public once again to get a sense of whether people are becoming more conscious about what they should or shouldn’t put down the drain – and what kind of action might be needed to help change persistent examples of environmentally damaging behaviour.
Take a look at some of the key findings of our 2019 survey, with a complete list of questions and answers from our survey below. Please feel free to use our findings for your own content, citing LanesforDrains.co.uk as you do so.
The key findings
We spoke to a total of 1,216 people for the 2019 survey, with the results indicating that awareness of many of the factors that cause drainage-related problems is on the increase:
- 77% of respondents say they have heard of fatbergs, up from 61% in 2018 and 47% in 2017
- Expanding media coverage of the fatberg phenomenon is the main factor in improving awareness levels, with 39% of those polled saying they had heard about fatbergs through national news
- Nearly 62% of those polled said they understood that wet wipes contain hidden plastic content
- When asked about the items that contribute to fatbergs, fat, oils and grease (FOG) was the most common answer (65%), followed by wet wipes, sanitary towels and nappies
- 64% of respondents described themselves as “very aware” of what should and shouldn’t go down the toilet or sink
However, understanding of other key factors remains relatively low:
- Respondents were unaware of the role certain common household items can play in blocking the drains and sewers, with less than 20% of those polled understanding that contact lenses, razor blades and medication can contribute to fatbergs
- 85% of those surveyed had never heard of concretebergs
- Less than 20% specifically identified plastic pollution and damage to buildings and roads as problems associated with fatbergs
- 63% do not know how to properly dispose of cement or household paint, increasing the risk that it will be poured into the drain and contribute to concreteberg formation
Many Brits remain shackled to bad habits that have been proven to cause damage to the drains and sewers and pollution in the oceans and waterways:
- 48% of those polled say they have poured oil and fat down their kitchen sink, which is slightly higher than the 47% who said so in 2017 and 2018, despite the widespread awareness of how harmful this is
- The top three damaging items people admit to having flushed down the toilet are flushable wet wipes, kitchen roll and tampons. 55% said they had flushed some form of wet wipe, and 34% had flushed a tampon; among female respondents, these figures rose to 58% and 46% respectively
- 79% of those surveyed said either they or a tradesperson working in their home had washed paint brushes used for decorating in the sink
However, our respondents also provided some thought-provoking insights into actions that could be taken to help consumers change these habits:
- 40% of those polled watched the BBC documentary Blue Planet II – among these, 57% have reduced the number of plastic bags they use, 52% recycle more, and
- 49% have cut the amount of plastic they buy. This shows the impact that TV programmes like this can have
- Around two-thirds of respondents said teaching primary and secondary school pupils about what not to put down the drain would be a good way of tackling pollution and fatbergs. Meanwhile, 52% called for more TV shows like Blue Planet, and 41% called for an awareness month
- 28% believe that those responsible for creating fatbergs should have to play a part in cleaning them up
- Laziness, convenience and a lack of education were identified as the main barriers to changing behaviour. Proposed solutions included making it easier or cheaper to recycle and dispose of waste; improvements to council refuse collection services; introducing the threat of fines; better education; and clearer information on product packaging
- 66% of respondents said they would be willing to participate in a month-long challenge to change their behaviour and tackle their bad waste disposal habits
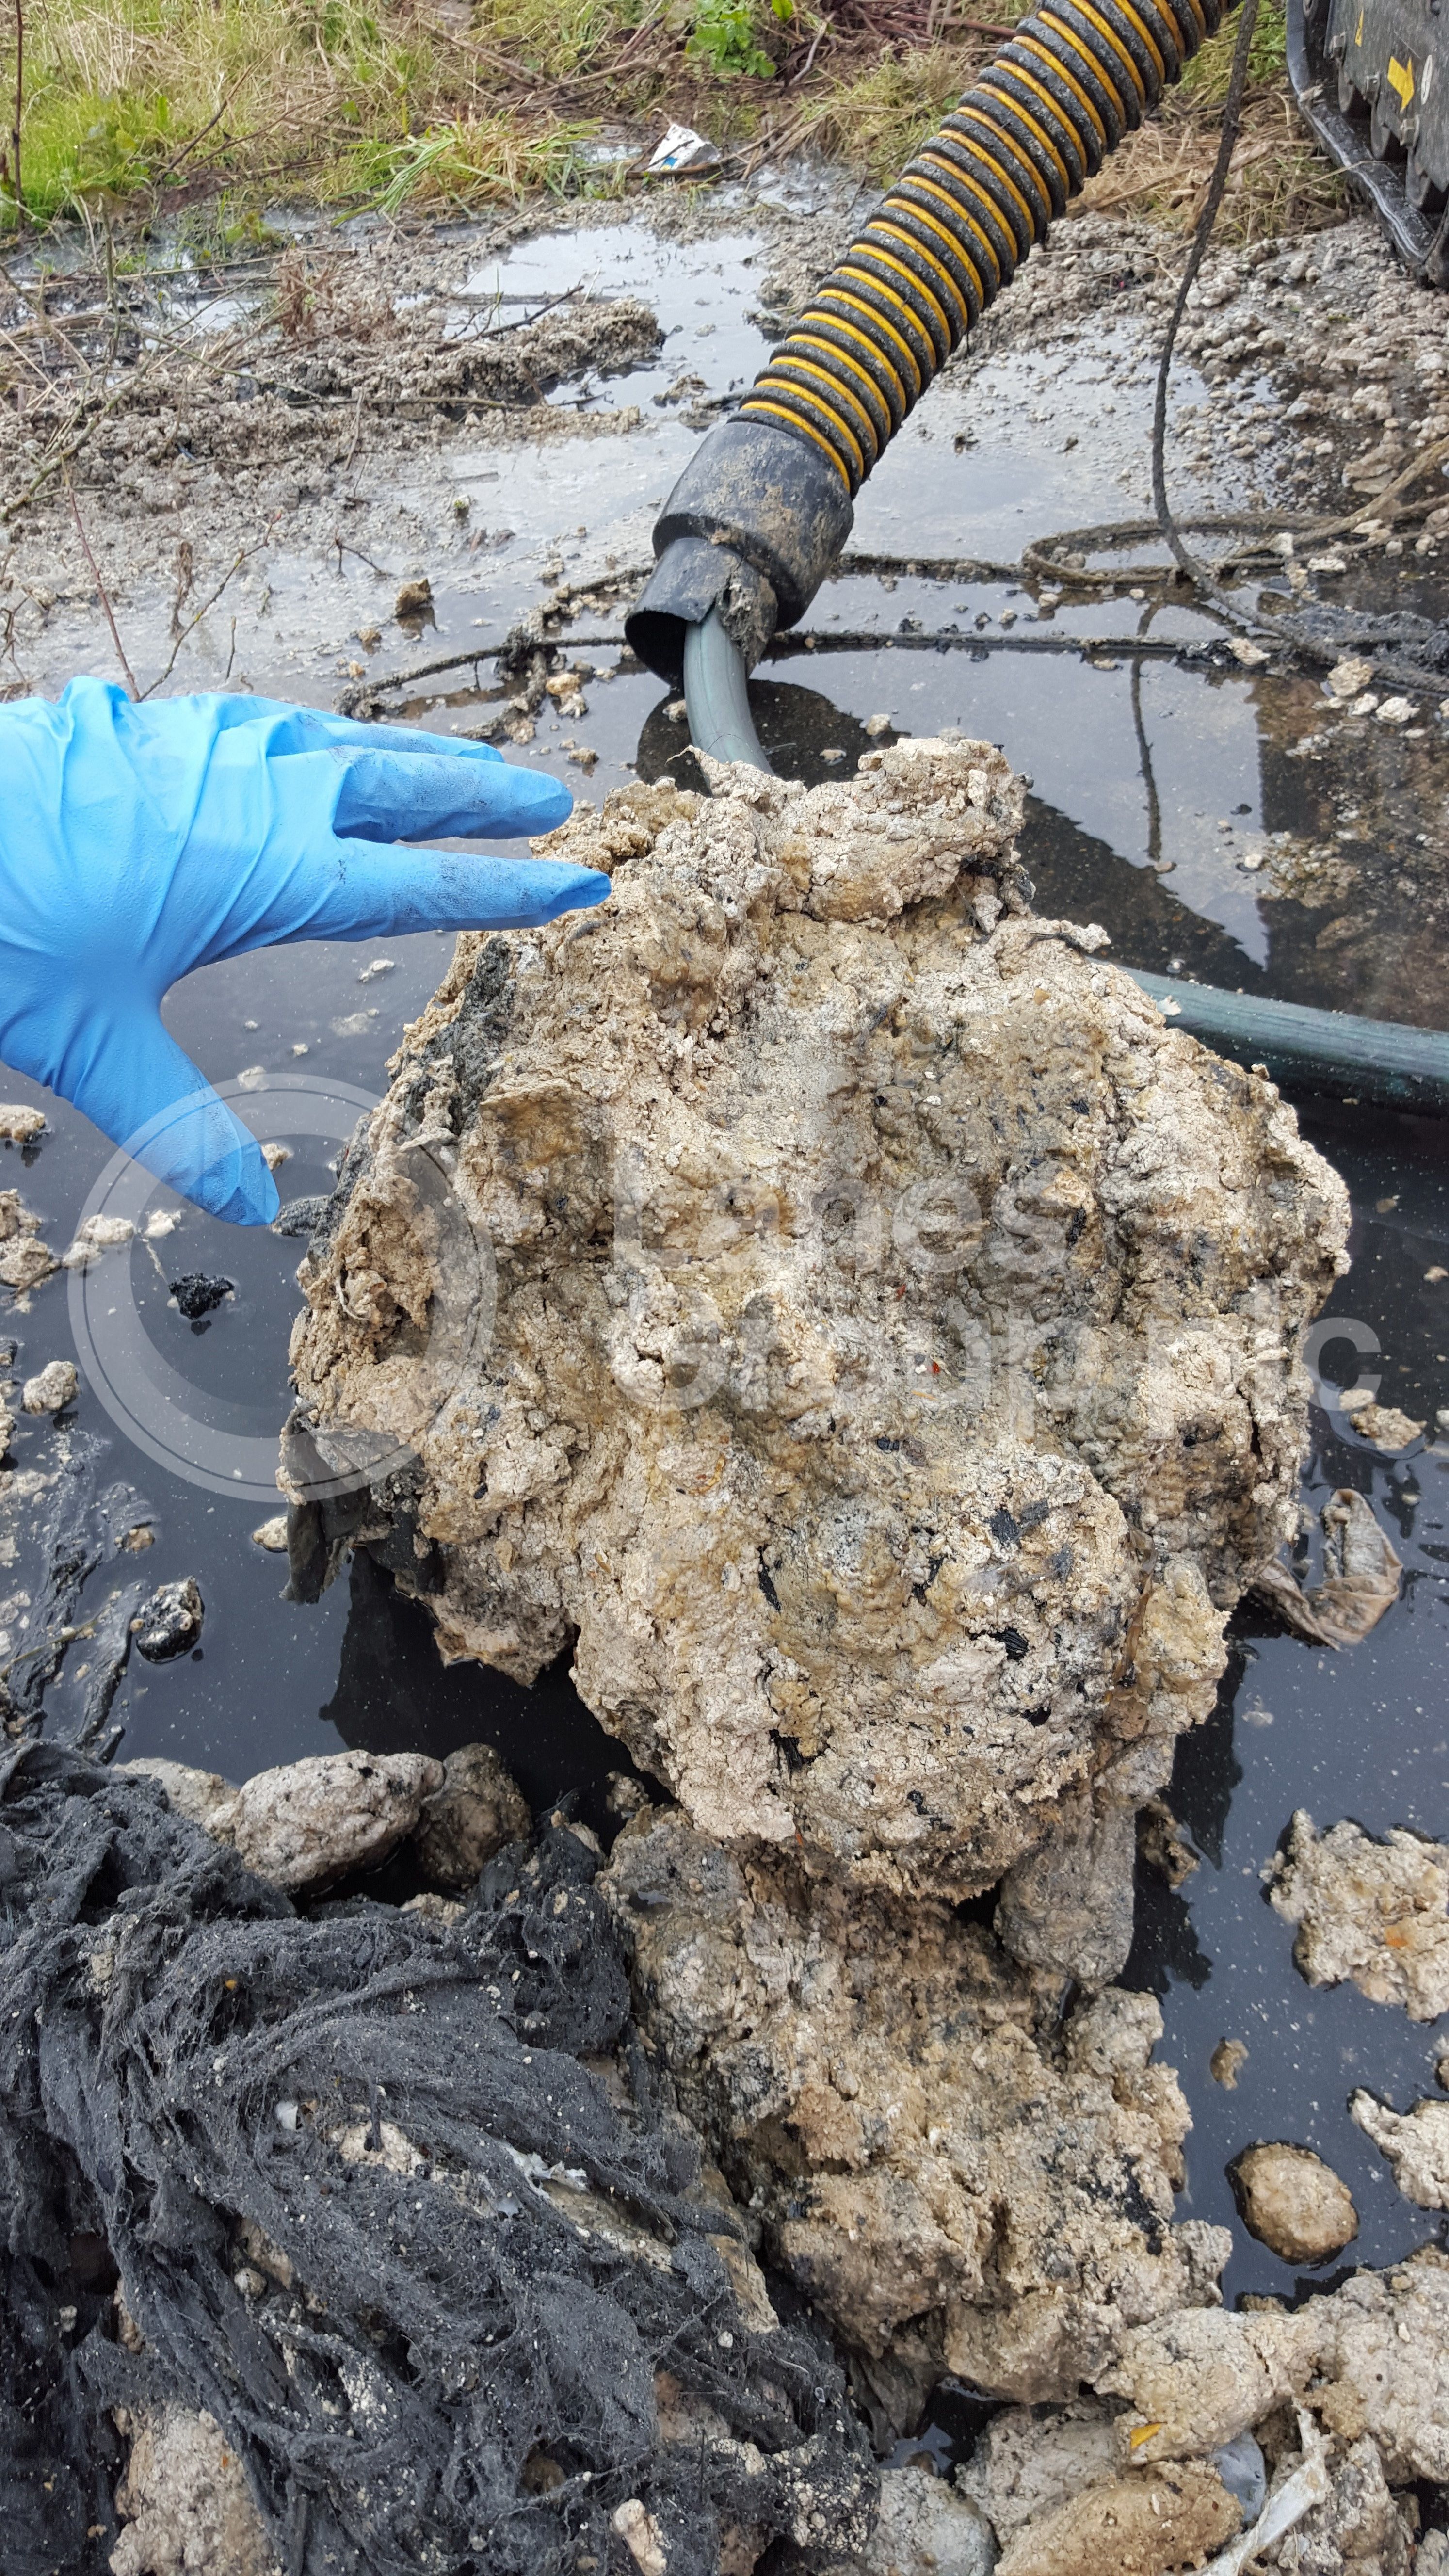
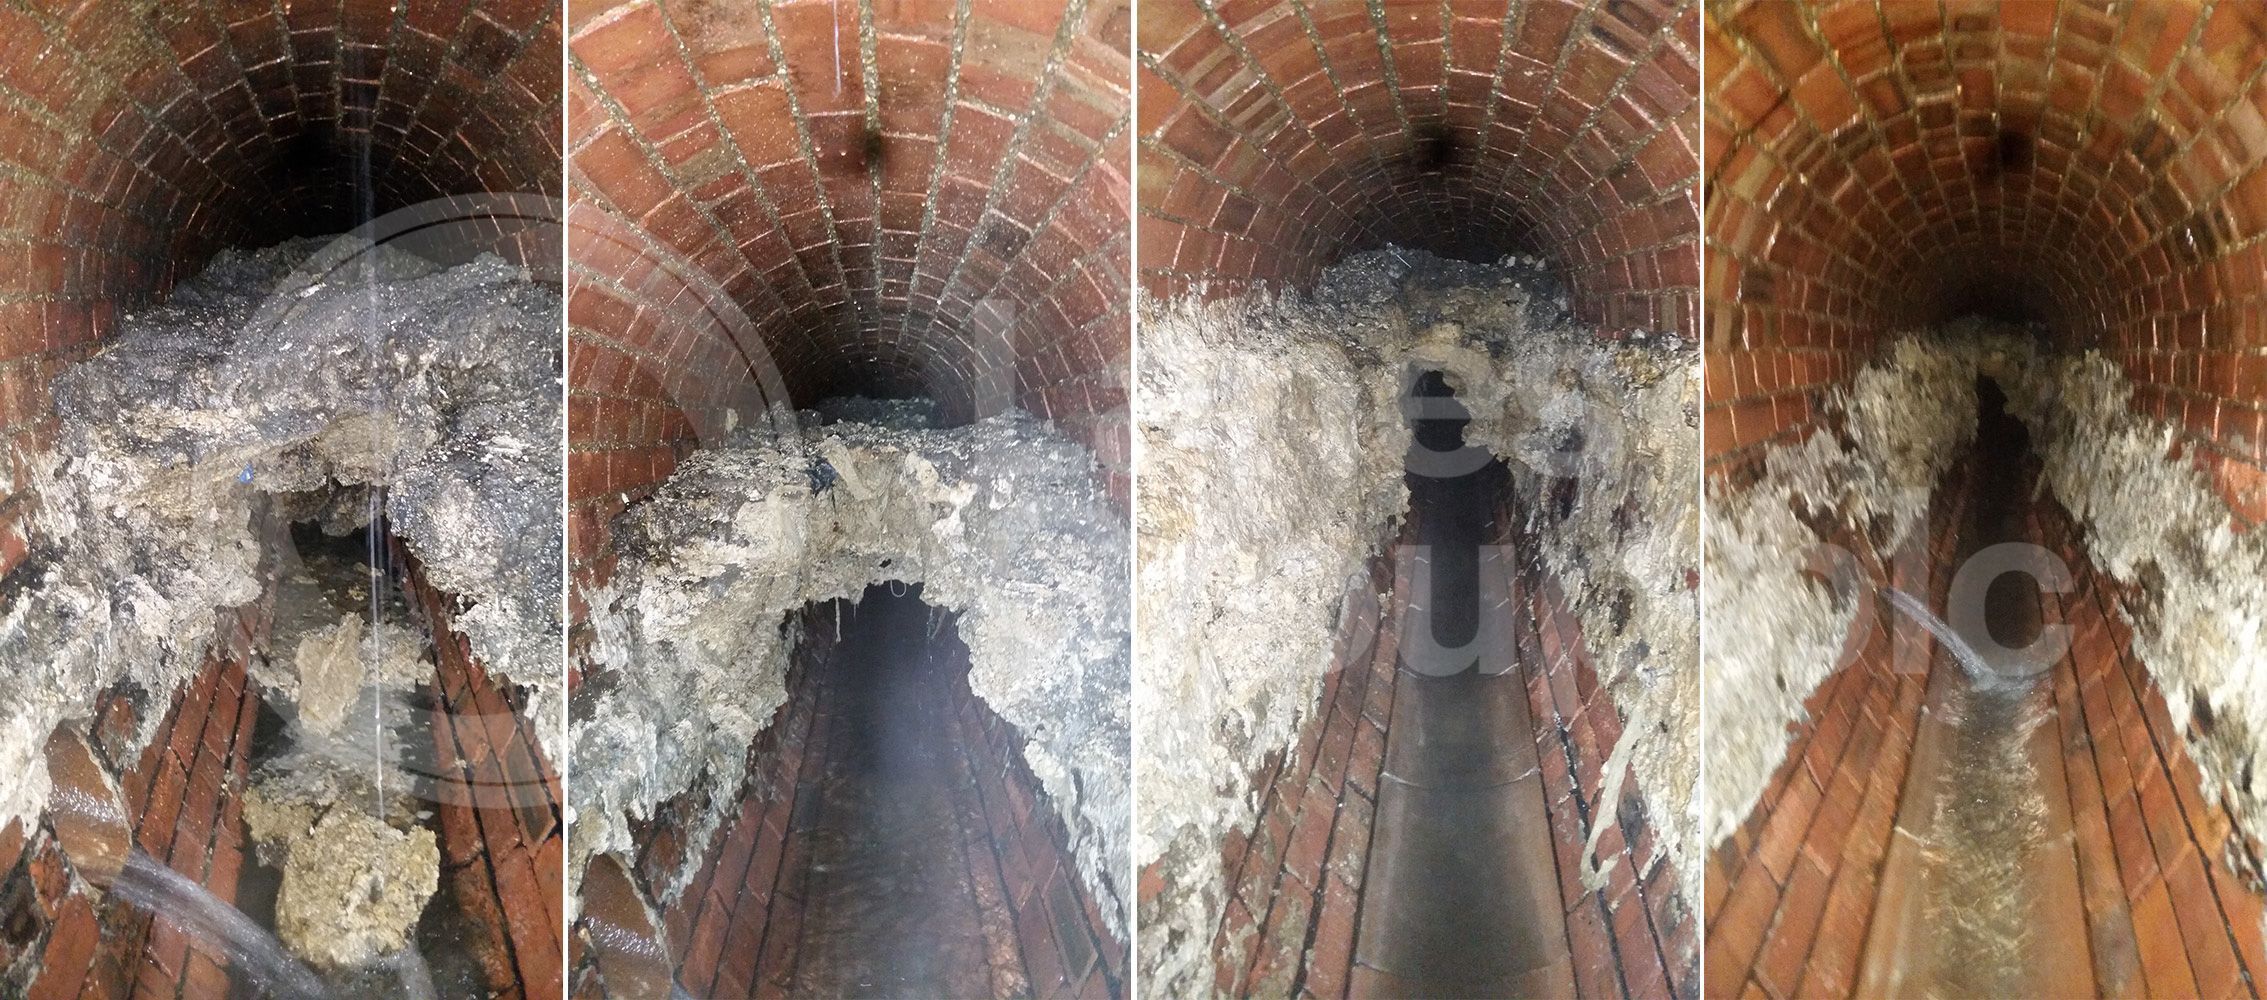
Take a look at how our engineers remove blockages from the sewers in this video.

The complete survey findings
Understanding fatbergs, concretebergs and hidden plastics
| Have you ever heard of the term ‘fatberg’? |
% |
Number of people |
| Yes |
76.81% |
934 |
| No |
23.19% |
282 |
| How did you first hear about fatbergs? |
% |
Number of people |
| When the Whitechapel fatberg was discovered |
11.46% |
107 |
| When the Sidmouth fatberg was discovered |
3.32% |
31 |
| I have heard about them on local news |
6.75% |
63 |
| I have heard about them on national news |
39.19% |
366 |
| I have read about them online |
11.46% |
107 |
| My child learnt about them at school |
0.21% |
2 |
| I have seen the fatberg display at the Museum of London |
0.54% |
5 |
| I have seen TV programmes about fatbergs |
13.28% |
124 |
| I can’t remember |
8.14% |
76 |
| Other |
5.67% |
53 |
| What do you think contributes to fatbergs? |
% |
Number of people |
| Wet wipes |
51.71% |
483 |
| Fat, oil and grease from cooking |
64.78% |
605 |
| Food particles |
32.87% |
307 |
| Cooking sauces |
26.55% |
248 |
| Kitchen roll |
29.12% |
272 |
| Tampons |
36.72% |
343 |
| Tampon applicators or wrappers |
33.83% |
316 |
| Sanitary towels |
40.90% |
382 |
| Sanitary towel wrappers |
29.87% |
279 |
| Nappies |
38.22% |
357 |
| Condoms |
33.08% |
309 |
| Condom wrappers |
26.45% |
247 |
| Contact lenses |
14.88% |
139 |
| Razor blades |
13.17% |
123 |
| Cotton buds |
28.05% |
262 |
| Medication |
12.42% |
116 |
| None of the above |
0.43% |
4 |
| All of the above |
55.03% |
514 |
| Have you ever heard of the term ‘concreteberg’? |
% |
Number of people |
| Yes |
14.88% |
181 |
| No |
85.12% |
1035 |
| Did you know that wet wipes can contain hidden plastics? |
% |
Number of people |
| Yes |
61.60% |
749 |
| No |
38.40% |
467 |
| What problems do you think fatbergs can cause? |
% |
Number of people |
| Blocked drains in homes |
42.76% |
520 |
| Blocked drains in local communities |
41.45% |
504 |
| Blocked sewers |
43.75% |
532 |
| Foul waste flooding |
31.33% |
381 |
| Damage to buildings |
18.50% |
225 |
| Damage to roads |
19.90% |
242 |
| Water pollution |
24.92% |
303 |
| Plastic pollution |
19.90% |
242 |
| None of the above |
0.58% |
7 |
| All of the above |
64.88% |
789 |
Habits and attitudes that contribute to drainage problems
| Have you ever poured oil or fat generated from cooking down your kitchen sink? |
% |
Number of people |
| Yes |
48.19% |
586 |
| No |
51.81% |
630 |
| Have you ever flushed one of the following products down the toilet? |
% |
Number of people |
| Wet wipe labelled as ‘flushable’ |
43.34% |
527 |
| Wet wipe not labelled as ‘flushable’ |
10.20% |
124 |
| Kitchen roll |
24.01% |
292 |
| Tampon |
34.13% |
415 |
| Tampon applicator or wrapper |
5.10% |
62 |
| Sanitary towel |
7.32% |
89 |
| Sanitary towel wrapper |
1.07% |
13 |
| Nappy |
0.58% |
7 |
| Condom |
10.03% |
122 |
| Condom wrapper |
0.90% |
11 |
| Contact lenses |
6.17% |
75 |
| Razor blades |
0.41% |
5 |
| Cotton buds |
7.98% |
97 |
| Medication |
6.09% |
74 |
| Something other than the 3 Ps (pee, poo and paper) |
8.96% |
109 |
| Other or none of the above |
19.41% |
236 |
| Which of the following statements best represents your attitude towards what you put down the toilet and drain? |
% |
Number of people |
| Out of sight, out of mind: I don’t think at all about what I put down the toilet and sink |
2.38% |
29 |
| I am trying to reduce what I put down the toilet and sink |
23.36% |
284 |
| I’m very aware of what should and shouldn’t go down the toilet and sink |
64.06% |
779 |
| I know what shouldn’t go down the toilet and sink, but I do it anyway |
2.30% |
28 |
| I need more education about what should and shouldn’t go down the toilet and sink |
7.89% |
96 |
| Are you more eco-friendly at work, or at home? |
% |
Number of people |
| I am more eco-friendly at work than I am at home |
5.52% |
27 |
| I am less eco-friendly at work than I am at home |
15.54% |
76 |
| I am equally eco-friendly in work and at home |
46.42% |
227 |
| I do not work |
23.72% |
116 |
| I work from home |
6.95% |
34 |
| Have you or a tradesperson working in your home ever done any of the following: |
% |
Number of people |
| Washed paint brushes used for decorating in the sink |
79.03% |
961 |
| Poured paint used for decorating down the sink |
3.70% |
45 |
| Poured paint used for decorating down a drain outside your home |
4.69% |
57 |
| Washed grouting tools in the sink |
17.68% |
215 |
| Poured water used for grouting down the sink |
10.28% |
125 |
| Poured grout down the sink |
1.48% |
18 |
| Poured grout down the drain outside your home |
2.88% |
35 |
| Rinsed tools covered in cement in the sink |
4.93% |
60 |
| Poured cement down the sink |
0.16% |
2 |
| Poured cement down a drain outside your home |
1.73% |
21 |
| Other or none of the above |
12.99% |
158 |
| Do you know the correct way to dispose of cement and household paint? |
% |
Number of people |
| Yes |
34.70% |
422 |
| No |
65.30% |
794 |
| Who should be responsible for clearing up fatbergs? |
% |
Number of people |
| People who have contributed to creating them |
27.71% |
337 |
| Local councils |
25.66% |
312 |
| Water companies |
19.41% |
236 |
| Business owners |
2.14% |
26 |
| National government |
7.65% |
93 |
| Entire communities where fatbergs are found |
15.30% |
186 |
| None of the above |
2.14% |
26 |
| Did you watch Blue Planet II? |
% |
Number of people |
| Yes |
40.21% |
489 |
| No |
59.79% |
727 |
| Has your behaviour changed since watching Blue Planet II? |
% |
Number of people |
| I have reduced the amount of plastic bags I use |
57.26% |
280 |
| I have reduced the amount of plastic I buy |
49.08% |
240 |
| I recycle more |
52.15% |
255 |
| I check products for hidden plastic content |
16.77% |
82 |
| I have reduced the amount of plastic and hidden plastic I put down the drain |
22.49% |
110 |
| I buy more eco-friendly alternatives |
29.65% |
145 |
| My behaviour hasn’t changed at all |
14.72% |
72 |
| Other |
2.66% |
13 |
| What do you think are the main barriers to changing behaviour from people who contribute to fatbergs? |
% |
Number of people |
| Laziness |
67.35% |
819 |
| Convenience |
51.07% |
621 |
| Cost |
15.54% |
189 |
| Lack of education |
57.89% |
704 |
| No viable alternatives to dispose of products |
32.07% |
390 |
| No incentive to change |
33.39% |
406 |
| Lack of awareness |
51.15% |
622 |
| ‘Out of sight, out of mind’ attitude |
42.02% |
511 |
| Other |
0.82% |
10 |
| Do you think that children are more aware than adults about what they should and shouldn’t put down the toilet and sink? |
% |
Number of people |
| Yes |
37.42% |
455 |
| No |
62.58% |
761 |
| Would you be willing to participate in a month-long challenge to reduce the amount of fat, oil, grease and hidden plastics poured down the sink and flushed down the toilet in your home or workplace? |
% |
Number of people |
| Yes |
66.20% |
805 |
| No |
33.80% |
411 |
Demographic data
| How old are you? |
% |
Number of people |
| Under 18 |
0.25% |
3 |
| 18-20 |
1.15% |
14 |
| 21-25 |
5.67% |
69 |
| 26-30 |
11.76% |
143 |
| 31-35 |
13.40% |
163 |
| 36-40 |
14.88% |
181 |
| 41-45 |
12.91% |
157 |
| 46-50 |
12.01% |
146 |
| 51-55 |
10.03% |
122 |
| 56-60 |
8.06% |
98 |
| 61-65 |
5.43% |
66 |
| 66-70 |
2.14% |
26 |
| 70+ |
2.30% |
28 |
| What gender are you? |
% |
Number of people |
| Female |
72.12% |
877 |
| Male |
26.48% |
322 |
| Non-binary |
0.58% |
7 |
| Prefer not to say |
0.82% |
10 |
| Where do you live? |
% |
Number of people |
| Bedfordshire |
1.07% |
13 |
| Berkshire |
2.47% |
30 |
| Bristol |
1.56% |
19 |
| Buckinghamshire |
1.15% |
14 |
| Cambridgeshire |
1.48% |
18 |
| Cheshire |
2.71% |
33 |
| Cornwall |
0.82% |
10 |
| Cumberland |
0.00% |
0 |
| Cumbria |
0.66% |
8 |
| Derbyshire |
1.64% |
20 |
| Devon |
2.55% |
31 |
| Dorset |
1.32% |
16 |
| Durham |
0.99% |
12 |
| East Sussex |
1.15% |
14 |
| Essex |
3.87% |
47 |
| Gloucestershire |
0.99% |
12 |
| Greater London |
3.78% |
46 |
| Greater Manchester |
4.03% |
49 |
| Hampshire |
2.88% |
35 |
| Herefordshire |
0.33% |
4 |
| Hertfordshire |
2.22% |
27 |
| Isle of Wight |
0.41% |
5 |
| Kent |
2.71% |
33 |
| Lancashire |
4.85% |
59 |
| Leicestershire |
1.32% |
16 |
| Lincolnshire |
1.89% |
23 |
| City of London |
2.63% |
32 |
| Merseyside |
2.22% |
27 |
| Norfolk |
1.97% |
24 |
| Northamptonshire |
1.32% |
16 |
| Northern Ireland |
1.23% |
15 |
| Northumberland |
0.49% |
6 |
| North Yorkshire |
1.97% |
24 |
| Nottinghamshire |
2.30% |
28 |
| Oxfordshire |
1.07% |
13 |
| Republic of Ireland |
0.08% |
1 |
| Rutland |
0.08% |
1 |
| Shropshire |
0.90% |
11 |
| Scotland |
6.83% |
83 |
| Somerset |
1.15% |
14 |
| South Yorkshire |
2.22% |
27 |
| Staffordshire |
1.40% |
17 |
| Suffolk |
1.15% |
14 |
| Surrey |
3.13% |
38 |
| Sussex |
0.90% |
11 |
| Tyne & Wear |
2.06% |
25 |
| Wales |
4.19% |
51 |
| Warwickshire |
0.74% |
9 |
| West Midlands |
4.03% |
49 |
| West Sussex |
0.49% |
6 |
| West Yorkshire |
3.70% |
45 |
| Wiltshire |
1.07% |
13 |
| Worcestershire |
0.66% |
8 |
| Yorkshire, East Riding |
1.15% |
14 |