The Facts About Fatbergs & Plastic Pollution – an infographic
The Facts About Fatbergs & Plastic Pollution – an infographic
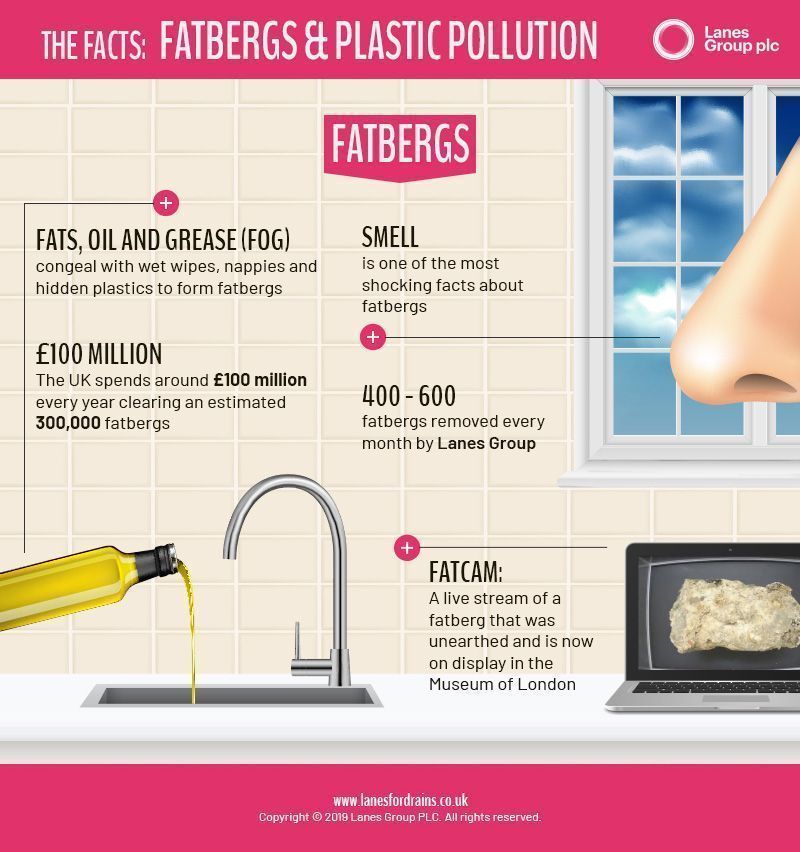
People in the UK are becoming increasingly aware of the danger that fatbergs and plastic pollution pose to our sewers and seas – but do they understand the full scale of the problem, or the way their day-to-day habits may be exacerbating the issue?
The consequences of fatbergs and plastic pollution are usually obvious to see, from blocked drains and polluted rivers to flooded streets and hazardous conditions for marine life. However, it can sometimes be hard for people to fully comprehend how such serious problems can result from simple acts of careless behaviour, whether this occurs by pouring cooking oil into the sink, or flushing a non-biodegradable wet wipe down the toilet.
As the UK’s leading privately-owned drainage contractor, Lanes for Drains is at the forefront of national efforts to tackle this problem, including through Unblocktober, our pioneering public awareness campaign. To make the facts about fatbergs and plastic pollution even clearer, we’ve put together a helpful infographic, laying out all of the stats and figures you’ll need to truly understand why it’s so important to look after your drains.
Click on the preview image below to open the infographic in full as a downloadable PDF
 If you’d like to check out the complete survey data upon which this visual guide is based, click here.